
Determining the true effectiveness of your Instagram content is essential for maximizing organic growth and proving your account’s authority. The key to this assessment is your Engagement Rate (ER), and the simplest way to find this crucial metric is by using an Instagram engagement rate calculator. These tools or formulas, especially those based on Reach rather than followers, provide a precise percentage that reveals how actively your actual viewers not just your total followers are interacting with your content. Understanding the mechanics of the calculator, which focuses on high-value actions like Saves and Shares, is the first step toward refining your social media marketing strategy and ensuring every piece of content contributes to your overall ROI.
The Modern Instagram Engagement Rate Calculator Explained
In 2025, a successful social media strategy relies on accurate social media analytics. The calculation of the Engagement Rate (ER) has evolved significantly to account for algorithm changes and the presence of inactive followers. The most reliable method focuses on Reach-Based ER, not the outdated follower-based metric.
Why Reach is the Only Metric That Matters
The fundamental shift in the Instagram engagement rate calculator is the denominator. Total Reach—the unique number of accounts that saw your post—is the truest measure of your content’s audience. Calculating ER based on reach shows the content’s true quality and resonance, regardless of how many dormant followers you may have.
| Calculation Method | Formula Denominator | Data Source | Strategic Value |
| Reach-Based ER (Recommended) | Total Reach (Unique Viewers) | Instagram Insights | Measures Content Quality; best for optimization and content marketing performance. |
| Follower-Based ER (Outdated) | Total Followers | Profile Header | Measures Account Size; often inaccurate for actual engagement. |
| Impression-Based ER | Total Impressions (Total Views) | Instagram Insights | Measures Ad Efficiency; often inflated by repeat views. |
How to Manually Use the Instagram Engagement Rate Calculator Formula
Even when using an automated tool, understanding the manual calculation process ensures you are inputting the correct data and interpreting the results accurately. The process involves two key steps: tallying high-value engagement and calculating the average.
Step 1: Defining and Tallying High-Value Engagements
The modern Instagram engagement rate calculator weighs engagements based on the effort required by the user, prioritizing actions that signal intent and future re-engagement.
Total Post Engagements=Likes+Comments+Shares+Saves
- Saves: The most valuable signal. It means the user intends to return to the content, indicating high utility or inspiration.
- Shares: Highly valuable, as it drives incremental reach and indicates strong endorsement of the content.
- Comments: Indicates a direct conversation and higher user effort than a like.
- Likes: The baseline metric; still important, but the lowest-weighted signal.
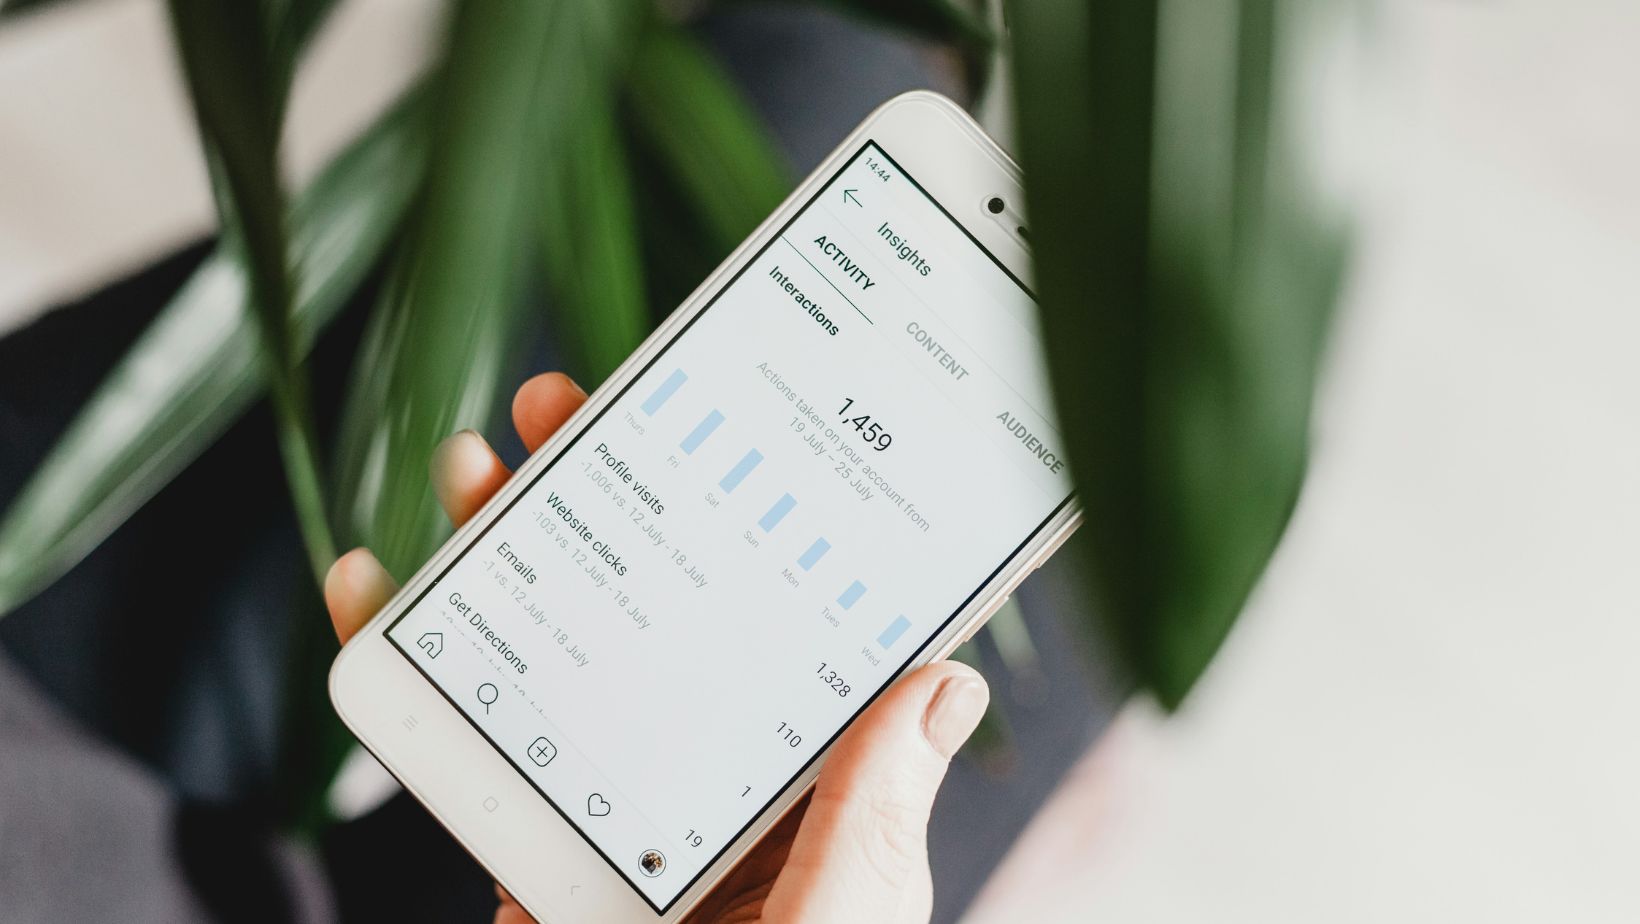
You must retrieve the specific metrics for Likes, Comments, Shares, and Saves for each post from your professional Instagram Insights.
Step 2: Applying the Reach-Based Formula
Once you have your total engagements and the post’s Reach (unique viewers), you can calculate the individual post’s ER.
Reach-Based ER=Total ReachTotal Engagements×100
To calculate your average ER for a selected period (e.g., the last 30 days):
- Sum the Total Engagements for all posts in the period.
- Sum the Total Reach for all posts in the period.
- Divide the combined Engagements by the combined Reach, then multiply by 100.
This final figure is the most accurate reflection of your overall content marketing performance.
Actionable Optimization: Using the ER for Strategic Growth
The goal of calculating your ER is not merely tracking, but using the data to inform your social media optimization. A systematic analysis of your ER data drives your organic growth strategy.
Diagnosing Low Engagement Rates
If your calculated Instagram engagement rate is below industry average (see FAQ), there are three common areas to diagnose:
- Content-Audience Mismatch: The content isn’t what your audience wants. Analyze your top 10 highest-ER posts to identify common themes (e.g., tutorials, humor, behind-the-scenes) and double down on those content pillars.
- Poor Timing/Reach: You’re posting when your audience is offline. Use Instagram Insights to identify your audience’s most active hours and adjust your posting schedule for maximum initial visibility.
- Low Value Proposition: Your content isn’t generating high-value actions. Shift focus to Reels and Carousel Posts, which are inherently designed to increase dwell time and generate Saves through high utility.
Segmenting ER by Content Format
Since the Instagram algorithm favors different formats, your Instagram strategy should calculate and track ER for each format separately.
- Reels ER: High reach, often among non-followers. Focus on trending audio and strong hooks for maximum discovery.
- Carousel Post ER: High save rate. Focus on utility, education, and detailed storytelling.
- Single Image/Video ER: Good for brand building and quick announcements. Focus on high visual quality and strong calls-to-action in the caption.
By segmenting, you can reallocate your content creation resources to the formats that deliver the highest Return on Investment (ROI) in terms of engagement.
Frequently Asked Questions (FAQ) about the Instagram Calculator
1. What is considered a “good” Instagram engagement rate for small accounts?
For small or micro-accounts (1,000 to 10,000 followers), a “good” Instagram engagement rate is typically between 4% and 8% (Reach-Based). These accounts benefit from highly niche audiences and should aim for the higher end of the benchmark. As follower counts grow, this percentage naturally decreases, making the Reach-Based ER the most consistent measure of true content marketing performance.
2. Why is my engagement rate consistently different from online calculator tools?
Differences usually occur because online tools often default to the less accurate Follower-Based ER (dividing by total followers), while you are likely calculating the more accurate Reach-Based ER (dividing by unique viewers). Additionally, many simple tools exclude high-value actions like Shares and Saves from the numerator. Always trust the formula using data directly from your Instagram Insights over external, generic calculators.
3. Do Story views and interactions count in the main ER calculation?
No, Story views and interactions are typically calculated separately from feed post engagement. Stories have their own metrics (taps forward/backward, replies, sticker interactions) and their own “Story Engagement Rate” formula. However, high Story engagement is still crucial for your overall social media strategy as it keeps your audience warm and encourages them to visit your profile and engage with your latest feed posts.
4. How can I use the ER to get better brand collaborations?
Brands look for authentic engagement, not just large follower counts. Presenting a high Reach-Based ER (e.g., 12%) is proof of strong ad copy effectiveness and content relevance. Use the ER data to negotiate by showing a potential partner your content’s conversion potential, stating: “I only reach X users, but Y% of them actively engage, guaranteeing a high-quality audience for your brand.”
5. What should I do if my calculated ER is extremely low (below 1%)?
An ER below 1% signals a significant problem with content-audience mismatch. Implement these immediate steps for social media optimization: 1) Audit your followers to remove bots or inactive accounts that are artificially inflating your denominator. 2) Post during peak hours (determined by Insights) to ensure initial visibility. 3) Stop posting low-effort content and focus intensely on creating only high-value Reels and Carousels that encourage the all-important Shares and Saves.